top of page

Search


Python Data Analysis Guided Project - Analyze Dog Breeds, Level 2, 31 min
Use Seaborn to understand how fur color affects height of dogs in this data analysis project DataSimple.education Certifications Data...
Jan 20, 20233 min read


Python Data Analysis Tips - Anomaly Detection Plot in Seaborn
DataSimple.education Certifications Data Analysis, Pandas, Seaborn, Plotly and More In Python with Seaborn learn how to make an anomaly detection plot. In this example, we use the Google stock price movement in our anomaly detection plot in Seaborn. Stock prices are prone to high volatility and as a portfolio manager, it can be helpful having the ability to detect anomalous movements. To make an anomaly detection plot we will we use several Seaborn plots together. In this
Jan 18, 20232 min read


Python ML Guided Project Credit Card Approvals Classification - Level 4, 40 min
In this supervised learning Python ML guided project we will be predicting whether or not someone was approved for a credit card. In this Python project, we will only be using the LogisticRegession() in Sklearn for this supervised classification problem. Although this project would work with RandomForestClassifier() or GradientBoostingClassifier() we will be focusing on error analysis in this classification problem. Understanding precision versus recall and why we would wan
Dec 13, 20222 min read

Python Machine Learning Guided Project Cell Phone Price Prediction - Level 3, 30 minutes
In the Python Project, we will use Pandas and Seaborn to perform our exploratory data analysis in en effort to understand how our features impact our target. A big aspect of this is paying close attention to the distributions of our features use in our supervised machine learning project.
Dec 12, 20222 min read
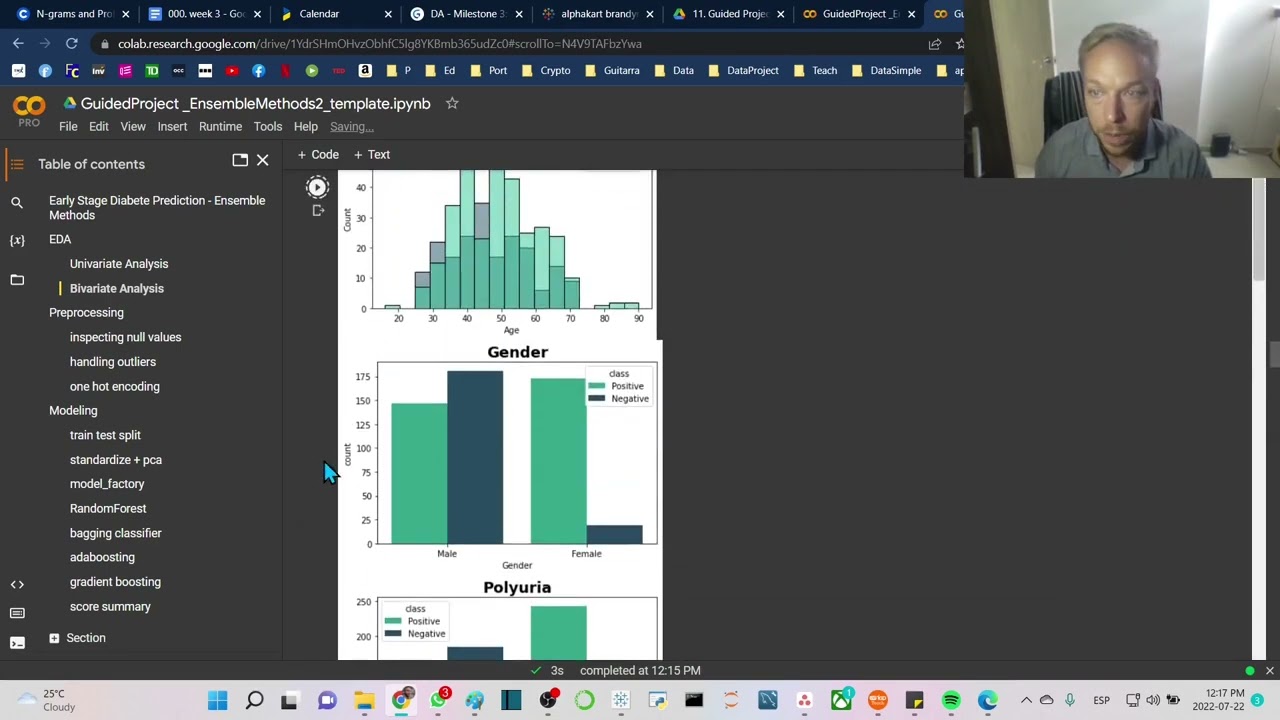
Python Machine Learning Guided Project, Early Diabetes Prediction - Level 2, 15 minutes
Follow along with this Python ML-guided project. In this beginner Python project, we build a classification model in Sklearn to predict if or not a person has early-stage diabetes in this medical prediction with machine learning.
Dec 12, 20222 min read


Python Data Analysis Guided Project Drugged Islanders, Level 1, 19 minutes
On this beginner-guided instructional project in Python we will explore with our Python data analysis skills what happened to the Islanders when the were given various drugs. Studying the effects of drugs using Pandas and Seaborn in Python on the isolated islander as they were given different medicine. A free instructional education tool for beginners. Template Workbook Solutions Workbook DataSimple.education Certifications Data Analysis, Pandas, Seaborn, Plotly and Mor
Dec 12, 20221 min read


Python Computer Vision Guided Project - Tensorflow Rock Paper Scissor, Level 4, 35 minutes
This Python computer vision project is a minimal level of difficulty to get computer vision to work well. Overfitting in computer vision, in part, has to do with our deep learning models learning the a shape it's recognized is in a certain position in the picture. To solve this we can use Tensorflow's ImageDataGenerator . This will require us to work with a Tensorflow dataset which can be a little tricky at first as it works differently than a Pandas DataFrame. The benefi
Dec 10, 20222 min read

Python Data Analysis Tips FacetGrid in Seaborn apply multple histplot violinplot hue
learn how to use seaborn FacetGrid with seaborn histplot and violinplot. the FacetGrid allows you to with the help of the argument hue, segment your data up to three times this really segments each group and allows you to analyze them at a very low level.
Dec 5, 20221 min read


Python Data Analysis learn how to control the sub-plotting functions while using Seaborn's jointplot
This modern-day scatterplot allows us to extract valuable insights but it can be tricky to get the right effect. learn the ins and outs...
Dec 3, 20221 min read


Python Data Analysis Guided Project Level 4, 17min- Analyze Stores sales from Supermarket Chain
In Python Data Analysis guided project. Using the template or solution workbook follow along with me and analyze the various store in this supermarket chain. We will use Pandas in Python for our analysis. This guided project in Python focuses on using the .apply function in Pandas. This is a recursive function that iterates through each row using a user-defined function that we will create. This works very similar to a for loop but is fewer lines of code.
Dec 1, 20221 min read

Python ML guided project Level 1, 24min - simple linear regression house price prediction
This intro project is great for those new to Sklearn. Learn how to set up an ML workflow. From exploratory data analysis to predictions. Use pandas and seaborn in Python to perform your data analysis. Then use Sklearn to do the train test split and make your predictions. Here we also look at the R-squared score to evaluate our model.
Nov 30, 20221 min read


data analysis tips - displot in seaborn. groupby categories to inspect lower level distributions
use the displot in seaborn to inspect your distributions grouping by up to 3 categories to allow you to inspect the distributions by each sub sub category group. displot in seaborn is a valuable data analysis tool. Understanding the distributions in your dataset is more important, in terms of getting a good score on your model, than knowing what the data represents in real life.
Nov 28, 20221 min read

Python data analysis guided project spaceship titanic data analysis for machine learn 31 min level 8
Data Analysis Guided Project in Python. Use your data analysis skills and analyze the spaceship titanic data from Kaggle Competition as...
Nov 26, 20221 min read

Python Data Analysis Tips swarmplot how when why to use a Seaborn swarmplot
Python beginner data analysis tips on how to use seaborn swarmplot(). Learn why you would use this distribution plot versus other types of seaborn plots. learn to analyze your data with the swarmplot()
Nov 25, 20221 min read

Python Data Analysis Tips countplot why use Seaborn's countplot
Learn to use Seaborn's countplot(). One of the few plots we can use directly on category columns. understanding the balance or imbalance in our categories is very important because it will affect how our machine-learning model learns. Understanding imbalance in categories is even more important with training a deep learning model.
Nov 25, 20221 min read

python data analysis tips boxenplot how when why to use a boxenplot
With Python, learn to use the boxenplot() in seaborn and a modern combination of a box and histogram() plot. learn when, why, and how to use the boxen plot to the fullest in your analyses. Boxenplot() are a great middle ground between the generalization of the boxplot mix with the detail from a histogram().
Nov 25, 20221 min read

Python Data Analysis guided project - Sri Lanka Economic Analysis. Level 7, 26 min
Study what happened to the Sri Lanka economy with python from 1966 to 2022 and see if you can understand what lead to the high inflation and low employment that the country faced during and after the pandemic. Use matplotlib.pyplot as plt to assist us in plotting two Seaborn lineplot and scatterplots together. They create stunning effects in your Seaborn plots and add a really nice professional touch to your seaborn plots. This is the Sri Lanka economy over time and so we
Nov 23, 20221 min read
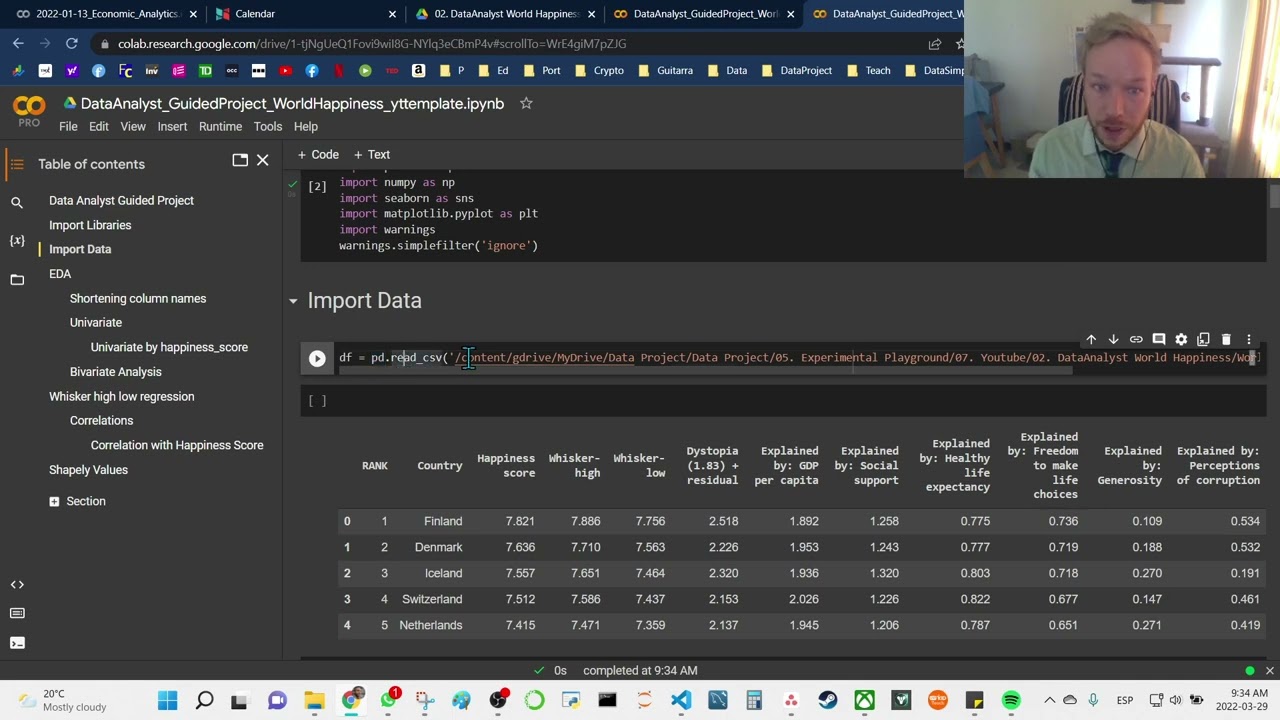
Python data analysis guided project - world happiness index - level 5, 30 min
Use pandas and seaborn in Python to analyze the world happiness index and better understand what affect a countries happiness by analyzing the data.
Nov 23, 20221 min read

Python Data Analysis Tips - Seaborn barplot
Join data science teacher brandyn as we learn how, why and when to use seaborn's barplot. How to extract the most valuable insights in your python data analysis with Seaborn. One on one time with Data Science Teacher Brandyn Data Science Teacher Brandyn YouTube Channel Send Data Science Teacher Brandyn a message if you have any questions On Facebook On Linkedin dataGroups : Showcase your DataArt on Facebook On linkedin Python data analysis group, share your analysis on
Nov 16, 20221 min read
bottom of page