top of page

Search


Python Data Analysis Tips - Plot on both left and right axis in Pandas
DataSimple.education Certifications Data Analysis, Pandas, Seaborn, Plotly and More in Python Pandas is the fastest and easiest to use plotting in python, this is especially true if you already happen to by using a Pandas DataFrame . And 90% of a data scientist's work is manipulating a Pandas DataFrame as your work with the data you are putting into your Sklearn model. Pandas make it easier to plot different scales together as well. Here we have two continuous features b
Feb 5, 20232 min read


Python Data Analysis Guided Project - Analyze Dog Breeds, Level 2, 31 min
Use Seaborn to understand how fur color affects height of dogs in this data analysis project DataSimple.education Certifications Data...
Jan 20, 20233 min read


Python Data Analysis Guided Project - Netflix Movies, Seaborn, Pandas, WordCloud Level 5, 33min
DataSimple.education Certifications Data Analysis, Pandas, Seaborn, Plotly and More Use your Python data analysis skills to better understand the Movies and TV shows in the Netflix dataset. We will use Pandas and Seaborn to perform our data analysis and better understand when new titles are released. Use WordCloud in Python to better understand the most common words in Movie and TV Show titles. Use plotting functions like the pie plot in Pandas . The countplot and histpl
Jan 13, 20231 min read


Real Python Data Analysis Guided Project - Google Forms Survey Response Analysis, Level 3, 21 min
DataSimple.education Certifications Data Analysis, Pandas, Seaborn, Plotly and More Use Pandas and Seaborn in Python to analyze the responses from a survey using Google Forms. Understand the survey response using data analysis skills In this Real Data Analysis in Python project understand the difficulties of dealing with a Real Data Set not found on data from Kaggle. Template Workbook Solutions Workbook Data Science Teacher Brandyn YouTube Channel One on one time with Da
Dec 31, 20221 min read


Python Data Analysis Tips when how to use the diverging palette versus light palette in Seaborn
Learn how to and when to use the diverging palette in Seaborn. The light and dark palettes are monochromatic in that they only have one color, when highlighting both positive and negative correlations it is better to use the diverging palette that will highlight how positive and how negative values are. DataSimple.education Certifications Data Analysis, Pandas, Seaborn, Plotly and More Data Science Teacher Brandyn YouTube Channel One on one time with Data Science Teache
Dec 28, 20221 min read


Python Data Analysis Guided Project Drugged Islanders, Level 1, 19 minutes
On this beginner-guided instructional project in Python we will explore with our Python data analysis skills what happened to the Islanders when the were given various drugs. Studying the effects of drugs using Pandas and Seaborn in Python on the isolated islander as they were given different medicine. A free instructional education tool for beginners. Template Workbook Solutions Workbook DataSimple.education Certifications Data Analysis, Pandas, Seaborn, Plotly and Mor
Dec 12, 20221 min read


Python Data Analysis Guided Project Level 4, 17min- Analyze Stores sales from Supermarket Chain
In Python Data Analysis guided project. Using the template or solution workbook follow along with me and analyze the various store in this supermarket chain. We will use Pandas in Python for our analysis. This guided project in Python focuses on using the .apply function in Pandas. This is a recursive function that iterates through each row using a user-defined function that we will create. This works very similar to a for loop but is fewer lines of code.
Dec 1, 20221 min read

Python data analysis guided project spaceship titanic data analysis for machine learn 31 min level 8
Data Analysis Guided Project in Python. Use your data analysis skills and analyze the spaceship titanic data from Kaggle Competition as...
Nov 26, 20221 min read
Python data analysis guided project - spaceship titanic data analysis for ML, Level 8, 31 min
Use pandas and seaborn in Python to analyze the spaceship titanic data from the Kaggle competition as if you were prepping it for a data scientist. extract insights using pandas seaborn and created user-defined functions to keep your analyses clean and to the point coding. Understand what insights need to be collected for a data scientist to build a model. In this 2 part project, you will have the opportunity to take over the modeling and be the data scientist. You will us
Nov 23, 20221 min read

Python Data Analysis guided project - Sri Lanka Economic Analysis. Level 7, 26 min
Study what happened to the Sri Lanka economy with python from 1966 to 2022 and see if you can understand what lead to the high inflation and low employment that the country faced during and after the pandemic. Use matplotlib.pyplot as plt to assist us in plotting two Seaborn lineplot and scatterplots together. They create stunning effects in your Seaborn plots and add a really nice professional touch to your seaborn plots. This is the Sri Lanka economy over time and so we
Nov 23, 20221 min read
Python Data Analysis guided project - Data Analyst Job Listings, Level 6, 23 min
Here we use Pandas and Seaborn in Python to go through the job listings for Data Analyst Job Postings. we'll have to do a lot of cleaning of the string features to be able to analyze this data set. Let's explore which type of Data Analyst gets hired, and has the biggest salaries. Business analyst, data analyst, BI analyst etc. Also explore important factors like education, year of experience, and location make on data analyst salaries in this instructional Python learning
Nov 23, 20221 min read
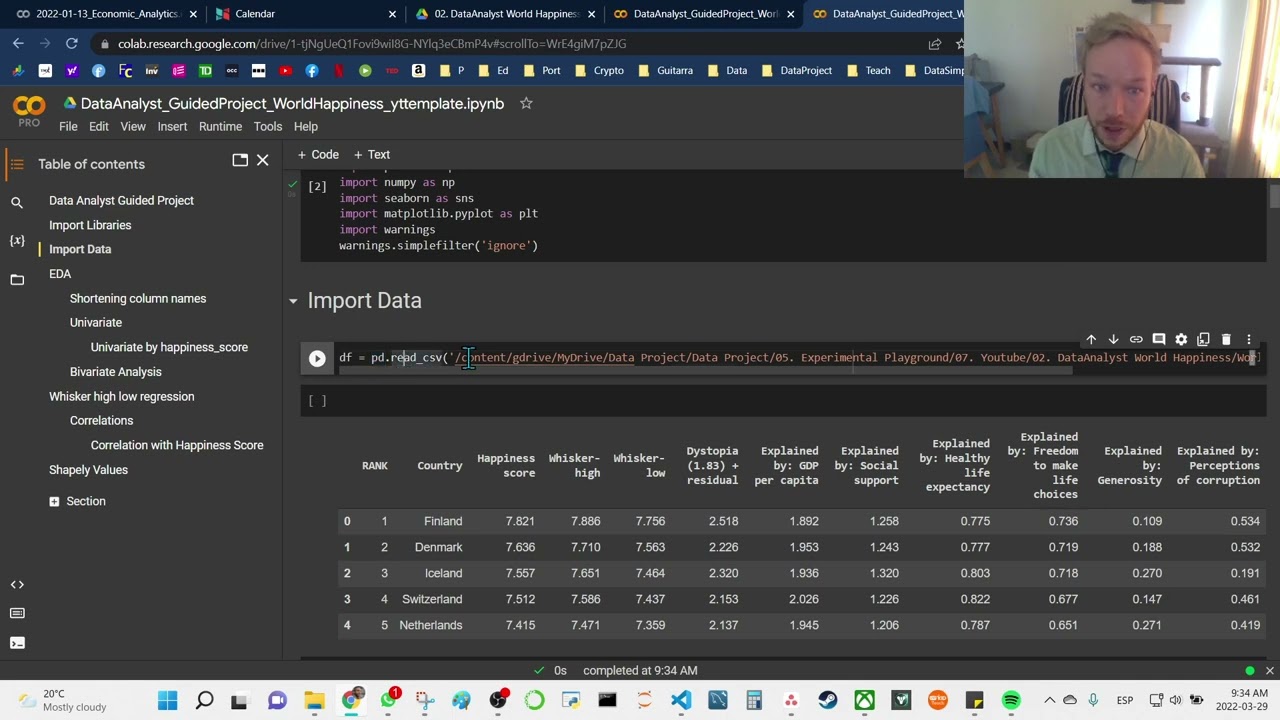
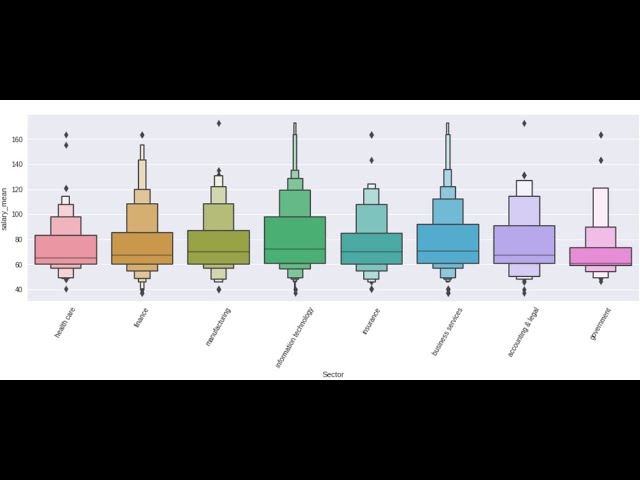
Python data analysis guided project - world happiness index - level 5, 30 min
Use pandas and seaborn in Python to analyze the world happiness index and better understand what affect a countries happiness by analyzing the data.
Nov 23, 20221 min read

python data analysis - Ukraine war June 2022 - level 5, 35 min
Data science and data analysis gives us access to the ability to make our own interpretations from the data. I wanted to see what was...
Nov 23, 20221 min read


Python Data Analysis Guided Project - Develop Marketing Campaign from Customer Data - level 3,29 min
Use the swarmplot in Seaborn in your Python Data Analysis Use pandas and seaborn in Python to analyze the purchasing patterns and relationships of supermarket customers' data in this instructional python guided project as we collect observations and insights that we combine in creative ways to generate profitable marketing strategies based on the data. When completing a data analysis it is less intimidating to just focus on the current task and search for individual insight
Nov 23, 20221 min read

Guided Project - Data Analysis in Python with Pandas and Seaborn, Level 1, 15 min
Level 1 data analysis with pandas and seaborn in Python follow along with me in this guided project with template and solution workbook.
Nov 16, 20221 min read
bottom of page