top of page

Search
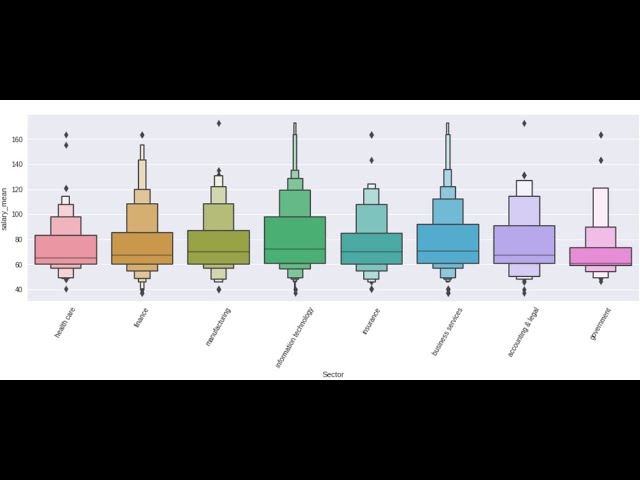
Python Data Analysis guided project - Data Analyst Job Listings, Level 6, 23 min
Here we use Pandas and Seaborn in Python to go through the job listings for Data Analyst Job Postings. we'll have to do a lot of cleaning of the string features to be able to analyze this data set. Let's explore which type of Data Analyst gets hired, and has the biggest salaries. Business analyst, data analyst, BI analyst etc. Also explore important factors like education, year of experience, and location make on data analyst salaries in this instructional Python learning
Nov 23, 20221 min read
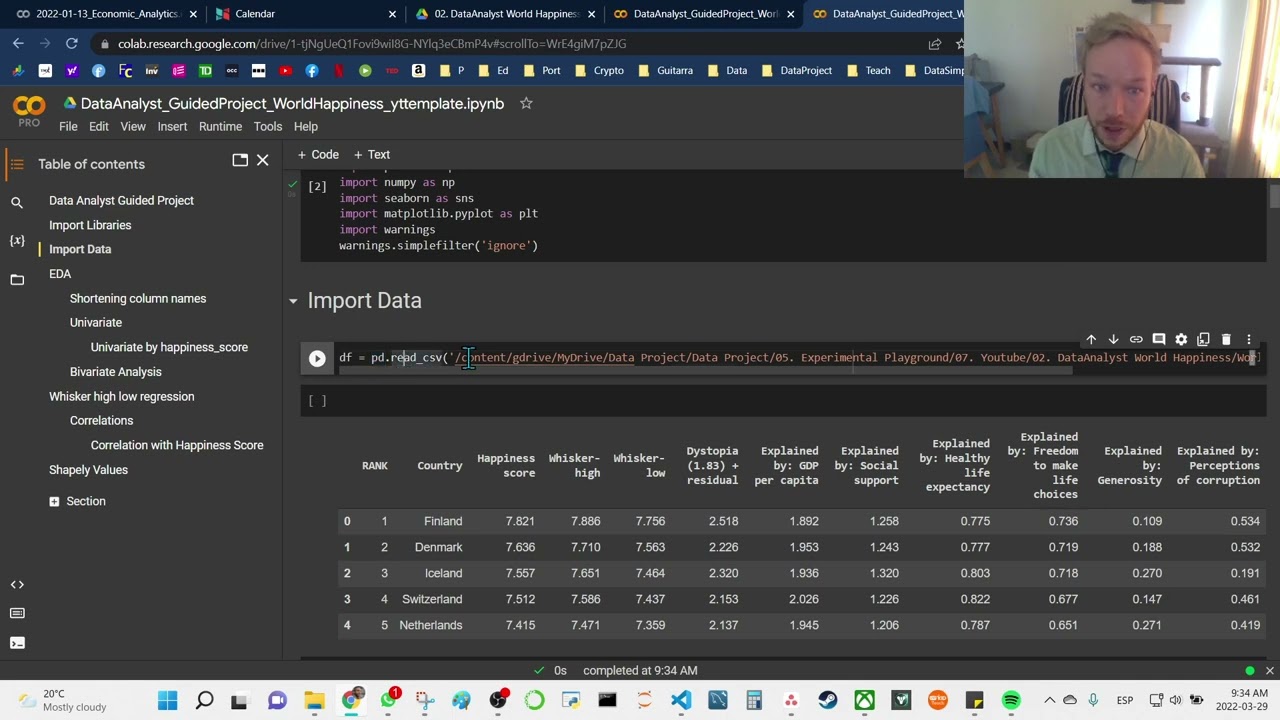
Python data analysis guided project - world happiness index - level 5, 30 min
Use pandas and seaborn in Python to analyze the world happiness index and better understand what affect a countries happiness by analyzing the data.
Nov 23, 20221 min read

python data analysis - Ukraine war June 2022 - level 5, 35 min
Data science and data analysis gives us access to the ability to make our own interpretations from the data. I wanted to see what was...
Nov 23, 20221 min read


Python Data Analysis Guided Project - Develop Marketing Campaign from Customer Data - level 3,29 min
Use the swarmplot in Seaborn in your Python Data Analysis Use pandas and seaborn in Python to analyze the purchasing patterns and relationships of supermarket customers' data in this instructional python guided project as we collect observations and insights that we combine in creative ways to generate profitable marketing strategies based on the data. When completing a data analysis it is less intimidating to just focus on the current task and search for individual insight
Nov 23, 20221 min read
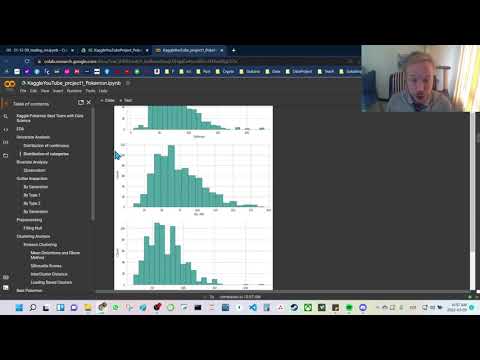
plot many distribution with for loop and seaborn
Use a for loop to loop through a list of the columns and use seaborn to plot all the histograms of our dataset and use them to plot each...
Nov 22, 20221 min read

python data analysis tips kdeplot in seaborn when and why a kde vs histogram
here we use the kernel density estimation plot, kdeplot, to plot distribution and learn when to use a kdeplot versus a histplot in seaborn. the kdeplot can generalize more than a histogram sometimes this can be help to understand overall, higher level pattern. Ai Art Collections DataSimple.education Certifications Data Analysis, Pandas, Seaborn, Plotly and More Data Science Teacher Brandyn YouTube Channel Connect with Data Science teacher Brandyn on facebook on li
Nov 22, 20221 min read


python data analysis tips lmplot seaborn control the underlying scatter & line plot with kws
learn to use the lmplot in seaborn. this plots the linear relationship of two variables and is built on top of the facetgrid and allows us to separate our data up to 3 levels and inspect and extract insights at a granular level. Python Ai-Enhanced Bootcamps Ai Art Collections DataSimple.education Certifications Data Analysis, Pandas, Seaborn, Plotly and More Data Science Teacher Brandyn YouTube Channel Connect with Data Science teacher Brandyn on facebook on linke
Nov 21, 20221 min read

python data analysis tips histplot in seaborn when and how to use histplot
learn to use how and when to use the histplot in seaborn to get the most out of this analytical tool. Inspecting and then understanding the distribution in you dataframe leads to go predictions. histograms are a really really important tool to understand yor distributions and then the preprocessing need to enhance predictions and scores Data Science Teacher Brandyn YouTube Channel Connect with Data Science teacher Brandyn on facebook on linkedin Python Ai-Enhanced B
Nov 20, 20221 min read


python data analysis seaborn lineplot
python data analysis tips for beginners, when to use lineplot seaborn and use hue argument correctly. lineplot has many valuable uses...
Nov 20, 20221 min read


FacetGrid with Seaborn in Python. 3 levels of categories
how and why to use teh facetgrid in seaborn
Nov 16, 20221 min read

Python Data Analysis Tips - Seaborn barplot
Join data science teacher brandyn as we learn how, why and when to use seaborn's barplot. How to extract the most valuable insights in your python data analysis with Seaborn. One on one time with Data Science Teacher Brandyn Data Science Teacher Brandyn YouTube Channel Send Data Science Teacher Brandyn a message if you have any questions On Facebook On Linkedin dataGroups : Showcase your DataArt on Facebook On linkedin Python data analysis group, share your analysis on
Nov 16, 20221 min read

Guided Project - Data Analysis in Python with Pandas and Seaborn, Level 1, 15 min
Level 1 data analysis with pandas and seaborn in Python follow along with me in this guided project with template and solution workbook.
Nov 16, 20221 min read
bottom of page